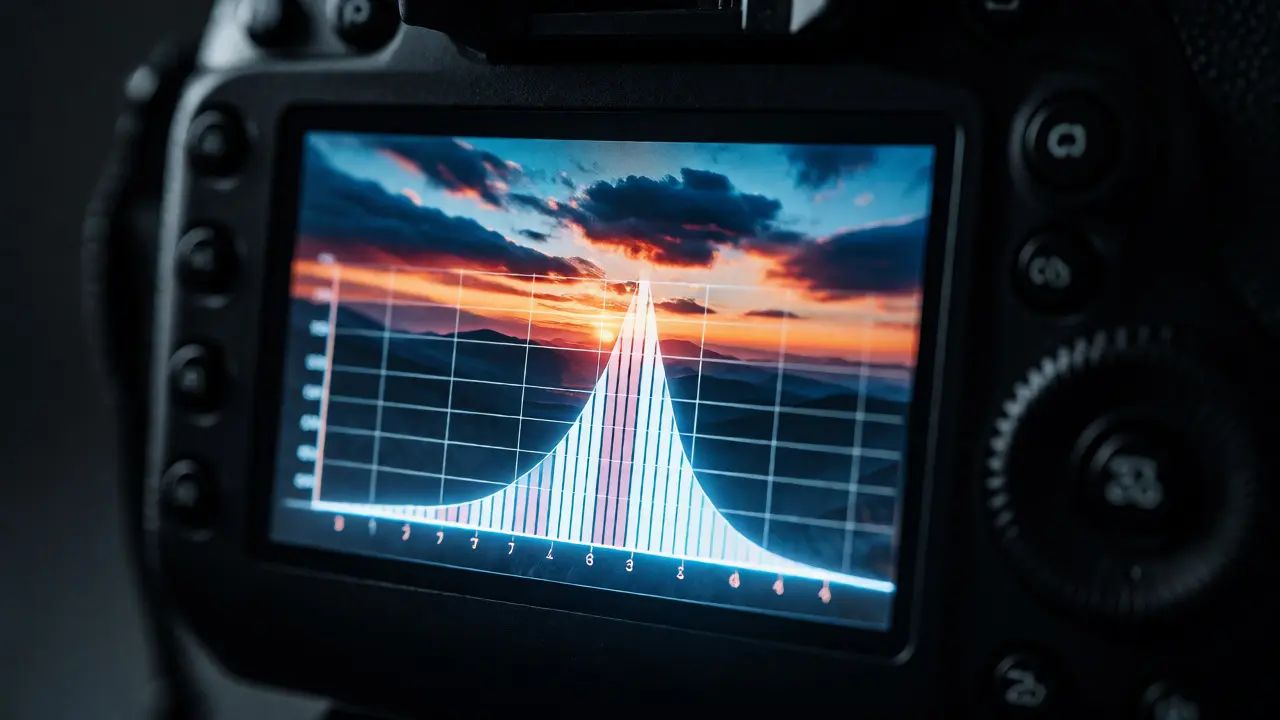
You just took a photo of a sunset. It looks great on your camera screen. You get home, open it up on your monitor, and realize the sky is blown out white while the shadows are pitch black. What went wrong? You trusted your eyes instead of the data. The Histogram is the single most useful tool for ensuring proper exposure in digital photography, yet many beginners ignore it because it looks like a scary math graph.
Here’s the truth: the histogram isn’t about art; it’s about information. It tells you exactly how much light hit each part of your sensor. If you learn to read its shape, you stop guessing and start controlling your images. No more crushed blacks or blown highlights. Just clean data that gives you room to edit later. Let’s break down what those mountains mean and how to use them to save your shots.
What Is a Histogram?
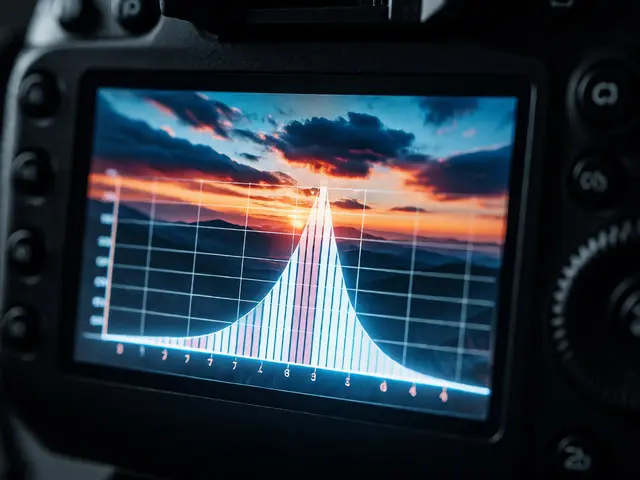
A histogram is a bar chart that represents the tonal distribution in your image. Think of it as a map of brightness. The horizontal axis (X-axis) runs from pure black on the left to pure white on the right. The vertical axis (Y-axis) shows the number of pixels at each brightness level. A tall peak means lots of pixels exist at that specific brightness; a low valley means few pixels do.
When you look at a standard RGB histogram, you’re actually seeing three graphs stacked together: Red, Green, and Blue. Most cameras let you view this combined luminance histogram by default. This graph sums up all color channels into one brightness curve. For most shooting situations, this is all you need. However, if you’re shooting something with intense colors-like a red sports car against a green field-you might want to check individual color channels to see if a specific color is clipping before the others.
The Three Main Shapes You’ll See
Most histograms fall into one of three basic categories. Recognizing these shapes helps you decide whether to adjust your settings immediately or if the shot is fine as-is.
The Bell Curve (Normal Distribution)
This is the classic "textbook" histogram. The data forms a smooth hill in the center, tapering off gently toward both edges. This usually happens when you shoot mid-tones under even lighting. Your subject has good contrast, but nothing is hitting the extreme limits of black or white. This is often ideal for portraits or landscapes where you want detail everywhere. If you see this shape, you’re likely in a safe zone. You have headroom to darken the shadows slightly or brighten the highlights during editing without losing critical detail.
The Skewed Left (Low Key)
If the mountain leans heavily to the left side of the graph, your image is dark. This doesn’t automatically mean it’s bad. In fact, if you’re shooting moody scenes, night skies, or dramatic portraits with deep shadows, this is exactly what you want. The danger lies in the far-left edge. If the data touches the wall on the left, you have "clipped shadows." This means parts of your image are pure black with zero detail. You can’t recover texture from pure black. If the curve stops short of the left wall, you still have shadow detail to work with in post-production.
The Skewed Right (High Key)
Conversely, if the bulk of the data sits on the right side, your image is bright. This is common for snow scenes, beach photos, or studio portraits with white backgrounds. Like the low-key scenario, touching the right wall indicates clipped highlights. Pure white areas lose all color and texture information. Once a highlight is blown out, it’s gone forever. You can’t bring back blue sky from a white blob. So, if you see the data piling up against the right edge, dial down your exposure compensation until the peak pulls back slightly from the wall.
Understanding Clipping: The Enemy of Detail
Clipping occurs when pixel values exceed the sensor's ability to record them. On the high end, values go above 255 (in an 8-bit system), resulting in pure white. On the low end, values drop below 0, resulting in pure black. When this happens, you lose tonal separation. Two different shades of gray become identical black. Two different blues become identical white.
Modern cameras offer a feature called "Highlight Alert" or "Blinkies." These flash over areas that are clipped. While helpful, they can be annoying if you intentionally want some specular highlights (like reflections on water) to blow out. Don’t panic if small spots blink. Focus on large areas. If the entire sky is blinking, fix it. If a tiny sun reflection is blinking, ignore it. That’s artistic choice, not technical failure.
Dynamic Range and the Sensor Limit
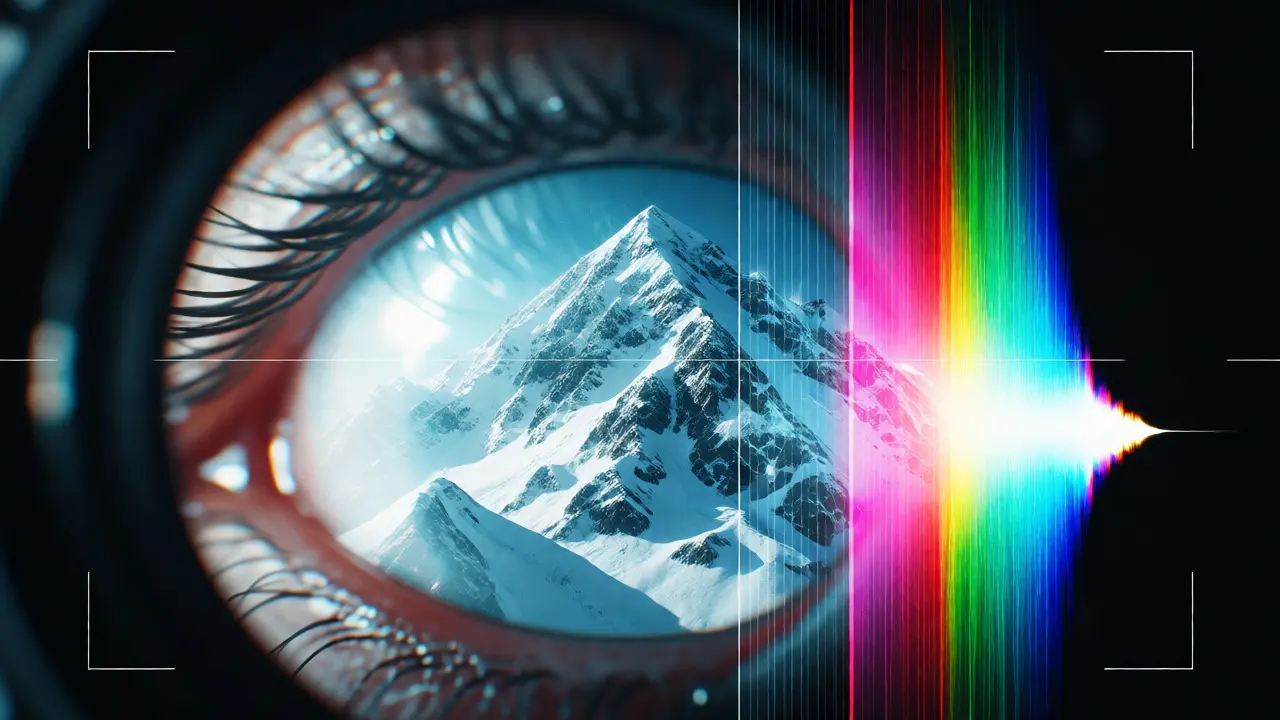
Your camera sensor has a finite Dynamic Range. This is the ratio between the darkest and brightest tones it can capture simultaneously. High-end full-frame sensors generally handle wider ranges than smaller crop-sensor cameras or smartphones. But regardless of your gear, the histogram shows you if you’re staying within those limits.
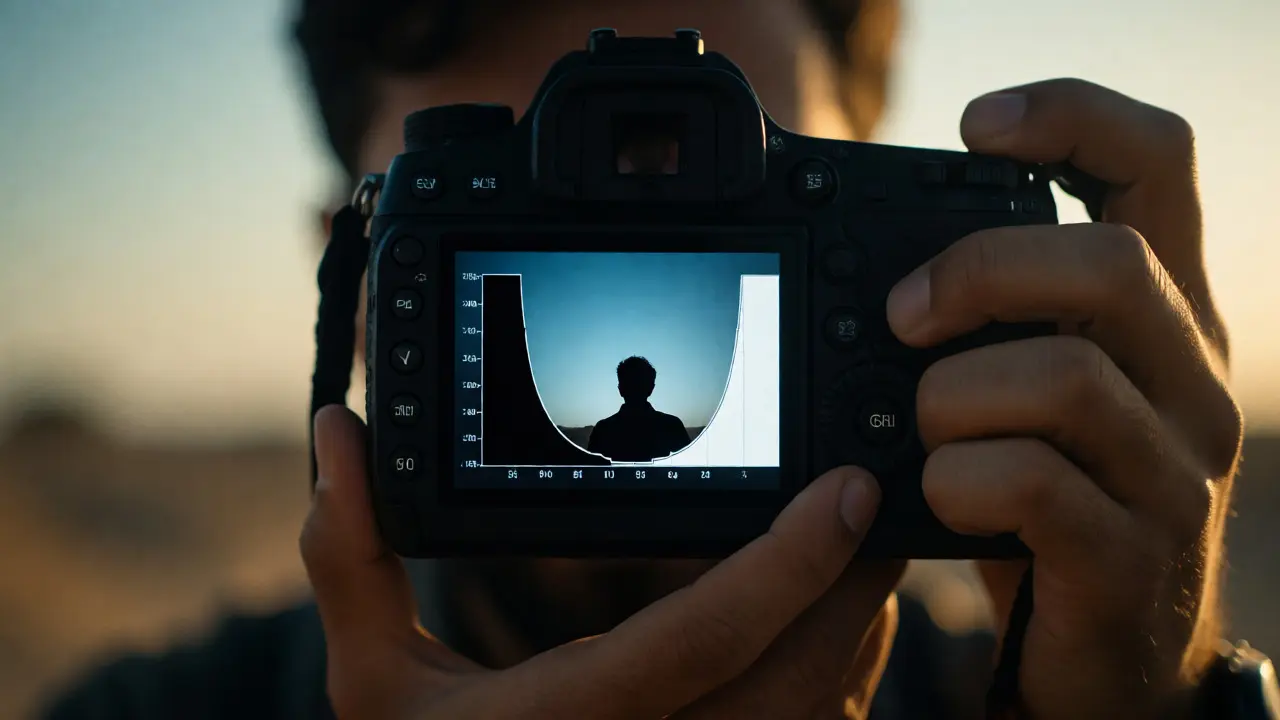
If your scene has extreme contrast-say, a dark cave entrance against a bright outdoor background-you might not fit everything into one frame. The histogram will show gaps in the middle or peaks pushed hard against both walls. In these cases, you have two choices:
- Expose for Highlights: Keep the bright parts detailed. Shadows will be noisy and dark, but you can lift them in editing.
- Expose for Shadows: Keep the dark parts clean. Highlights will clip, which is often unrecoverable.
Generally, exposing to the right (ETTR) is preferred by pros. This means pushing the histogram as far right as possible without clipping the whites. Why? Because digital noise lives in the shadows. By capturing more light, you keep the signal-to-noise ratio high. You then darken the image in post-processing, effectively hiding the noise.
Reading Color Channels Specifically
While the luminance histogram is your daily driver, color channels matter in specific scenarios. Imagine photographing a vibrant red rose against a dark green leaf. The overall luminance histogram might look balanced. But if you switch to the Red channel view, you might see the reds clipping. This means the red pigment is so saturated that it’s turning into orange-white mush. The same applies to blue skies or yellow flowers.
To check this, access your camera’s menu and select "RGB Histogram" instead of "Luminance." Look for spikes touching the right edge in any single color column. If only the Red channel clips, you might need to reduce saturation or exposure slightly. If all three channels clip together, it’s a general overexposure issue.
Practical Workflow: From Screen to Settings
How do you actually use this info while shooting? Here is a simple checklist to integrate histogram reading into your routine.
- Shoot in RAW: JPEGs bake in decisions. RAW files retain more data, allowing you to recover slight clipping that a histogram might flag as risky.
- Check the Histogram After Every Major Change: If you change your aperture or ISO, glance at the graph. Did the shape shift? Did new clipping appear?
- Use Spot Metering for Tricky Scenes: If the average histogram confuses you, meter specifically for the brightest important area. Ensure that spot doesn’t clip.
- Ignore Small Spikes: Tiny needles sticking up are often noise or minor artifacts. Focus on the broad shoulders of the curve.
| Shape Description | Visual Cue | Potential Issue | Quick Fix |
|---|---|---|---|
| Centered Peak | Bell curve in middle | None (Ideal) | Proceed with confidence |
| Left Touch | Data hits left wall | Crushed Shadows | Increase Exposure Compensation (+EV) |
| Right Touch | Data hits right wall | Blown Highlights | Decrease Exposure Compensation (-EV) |
| Gaps in Middle | U-shape or M-shape | Extreme Contrast | Use Flash, HDR, or Accept Trade-off |
| Single Channel Clip | Red/Green/Blue spike | Color Saturation Loss | Reduce Saturation or Adjust White Balance |
Why Your Camera Screen Lies to You
You might ask, "Why bother with the histogram if I can just look at my LCD?" Because camera screens lie. They are small, often too bright, and calibrated differently across brands. A sunny day makes the screen look washed out, tricking you into thinking the photo is underexposed. A dim room makes it look rich, hiding blown highlights. The histogram is objective. It doesn’t care about ambient light or your tired eyes. It reports raw pixel values. Trust the numbers, not the glow.
Also, remember that what looks good on the back of your camera might not print well. Printers have their own dynamic range limitations. Ensuring your digital file has full tonal spread via the histogram ensures the best possible starting point for any output medium.
Frequently Asked Questions
Is a centered histogram always correct?
No. A centered histogram is typical for evenly lit scenes with mid-tones, but it is not a rule. Snow scenes should skew right, and night scenes should skew left. Judge the histogram based on the content of the scene, not a fixed position.
Can I fix clipped highlights in Lightroom?
Sometimes. If the clipping is minor and you shot in RAW, pulling down the highlights slider might reveal some detail. However, if the histogram showed a solid block against the right edge, that data is likely lost forever. Prevention is better than cure here.
Should I worry about noise in the shadows?
Yes, but prioritize keeping highlights intact first. Noise can be reduced in software. Blown highlights cannot be recovered. Expose to protect highlights, then manage noise during editing.
Does the histogram change if I change my picture style?
On many cameras, the live view histogram reflects the current picture style (contrast, saturation). If you increase contrast in-camera, the histogram may show more clipping than the actual RAW file contains. Check your manual to see if your histogram displays RAW data or JPEG preview data.
What is the 'gap' in the middle of a histogram?
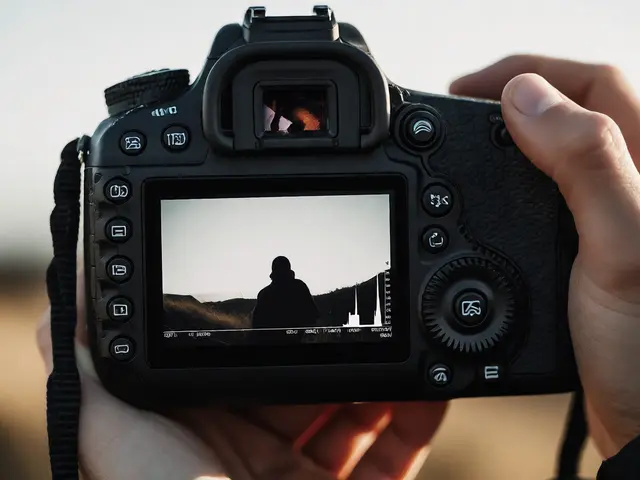
A gap in the middle usually indicates high contrast, such as a silhouette against a bright background. There are no mid-tone pixels because the scene consists mostly of dark subjects and bright skies. This is normal for silhouettes but problematic if you wanted detail in the subject.